We’ve redesigned the Statistics Module in order to help you get a better understanding of your listeners! The module is now broken down into 7 tabs to give you detailed statistics regarding the listening habits of your audience.
In this article we’ll be looking at the new and improved module, as well as some top tips in order to help you analyse and understand the results.
1/ At the moment
2/ Unique listeners
3/ Sessions
4/ Session duration
5/ Location
6/ Music
7/ Sources
1/ At the moment
This first tab gives you information regarding your current listeners. You’ll easily be able to see the number people who are listening to your radio station in real time. The table on the left-hand side will give you details such as:
1: The IP address or player for each listener
2: The country they are listening from
3: Their total listening time
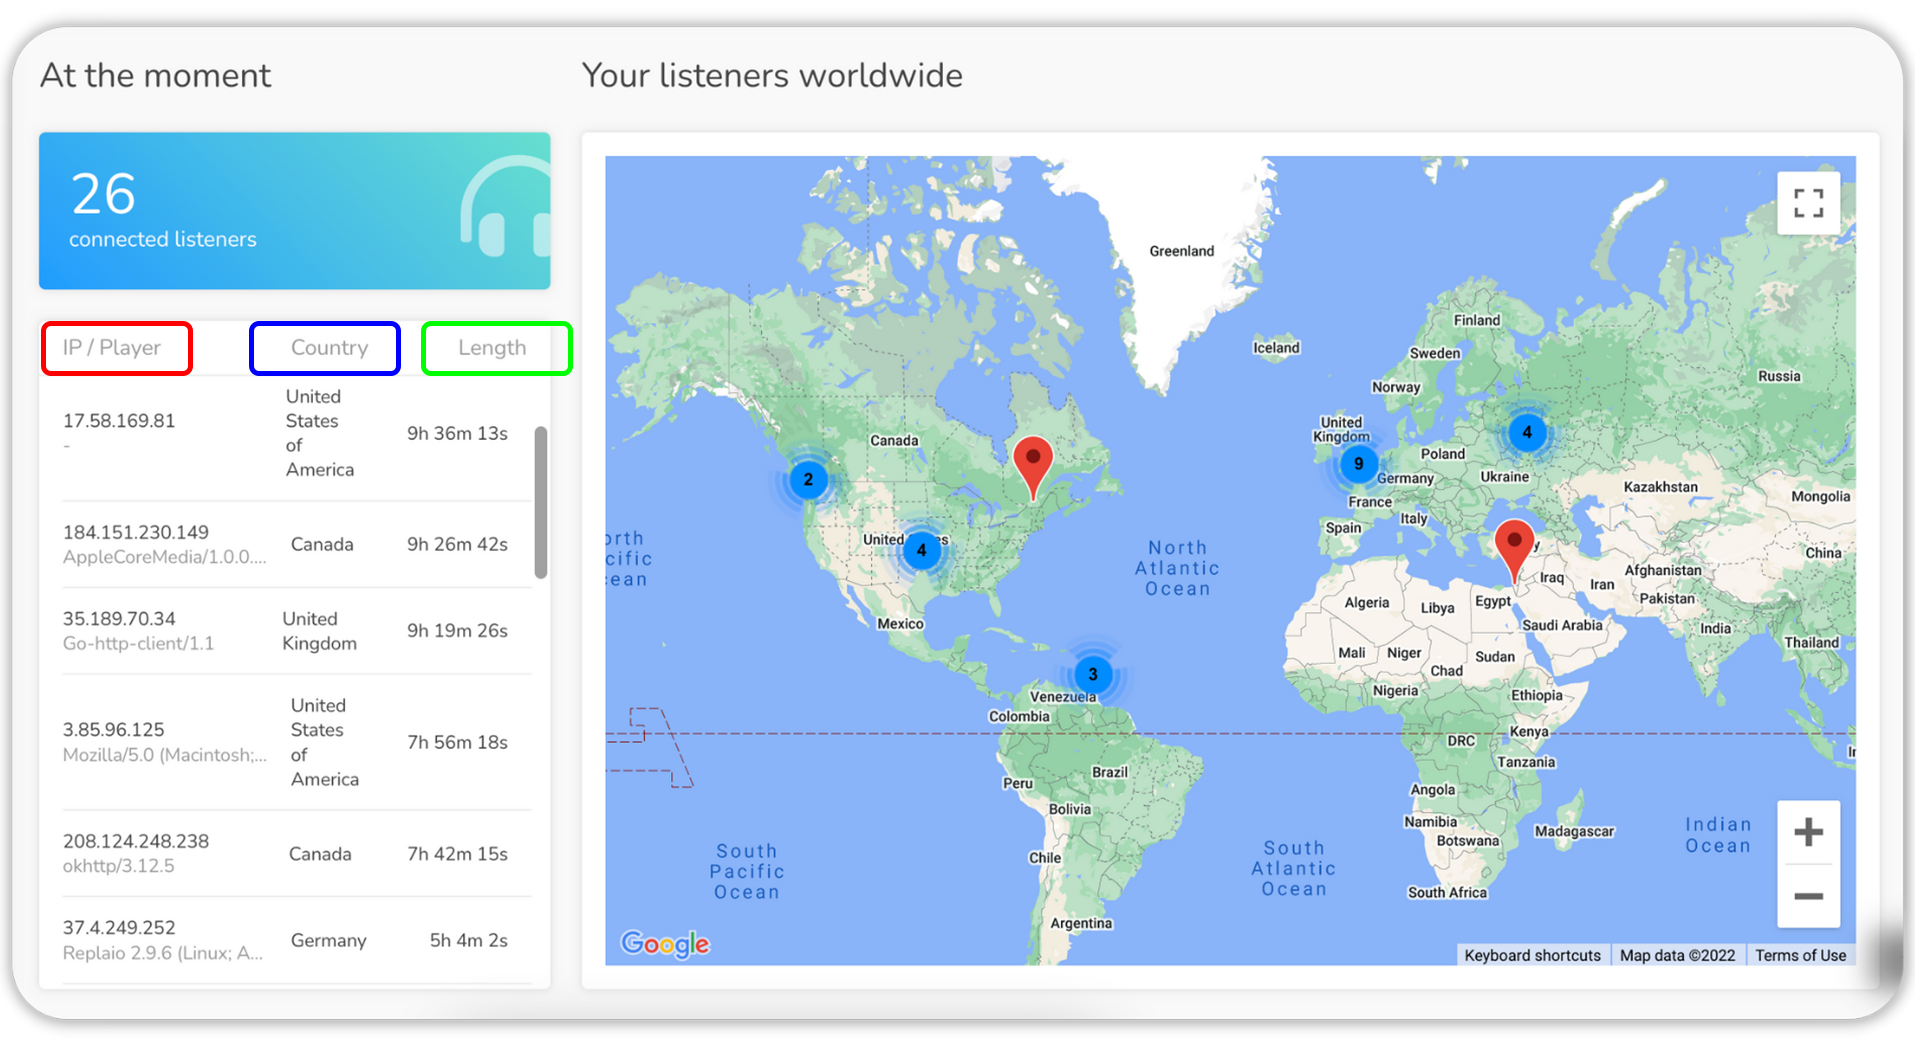
The interactive world map provides a visual representation of where the people listening to your radio are located. Multiple listeners in one location are represented by blue and yellow circles.
Interpreting your “At the moment” statistics
This information can be extremely helpful when it comes to understanding how many people are tuning in for a specific show for example! It’s also a great way to see which time zone you should accommodate to according to the number of listeners in a specific part of the world.
2/ Unique listeners
Let’s start by defining what a “unique listener” means. For example, if someone connects to your radio stream 3 times in one day, they will be counted as 1 unique listener.
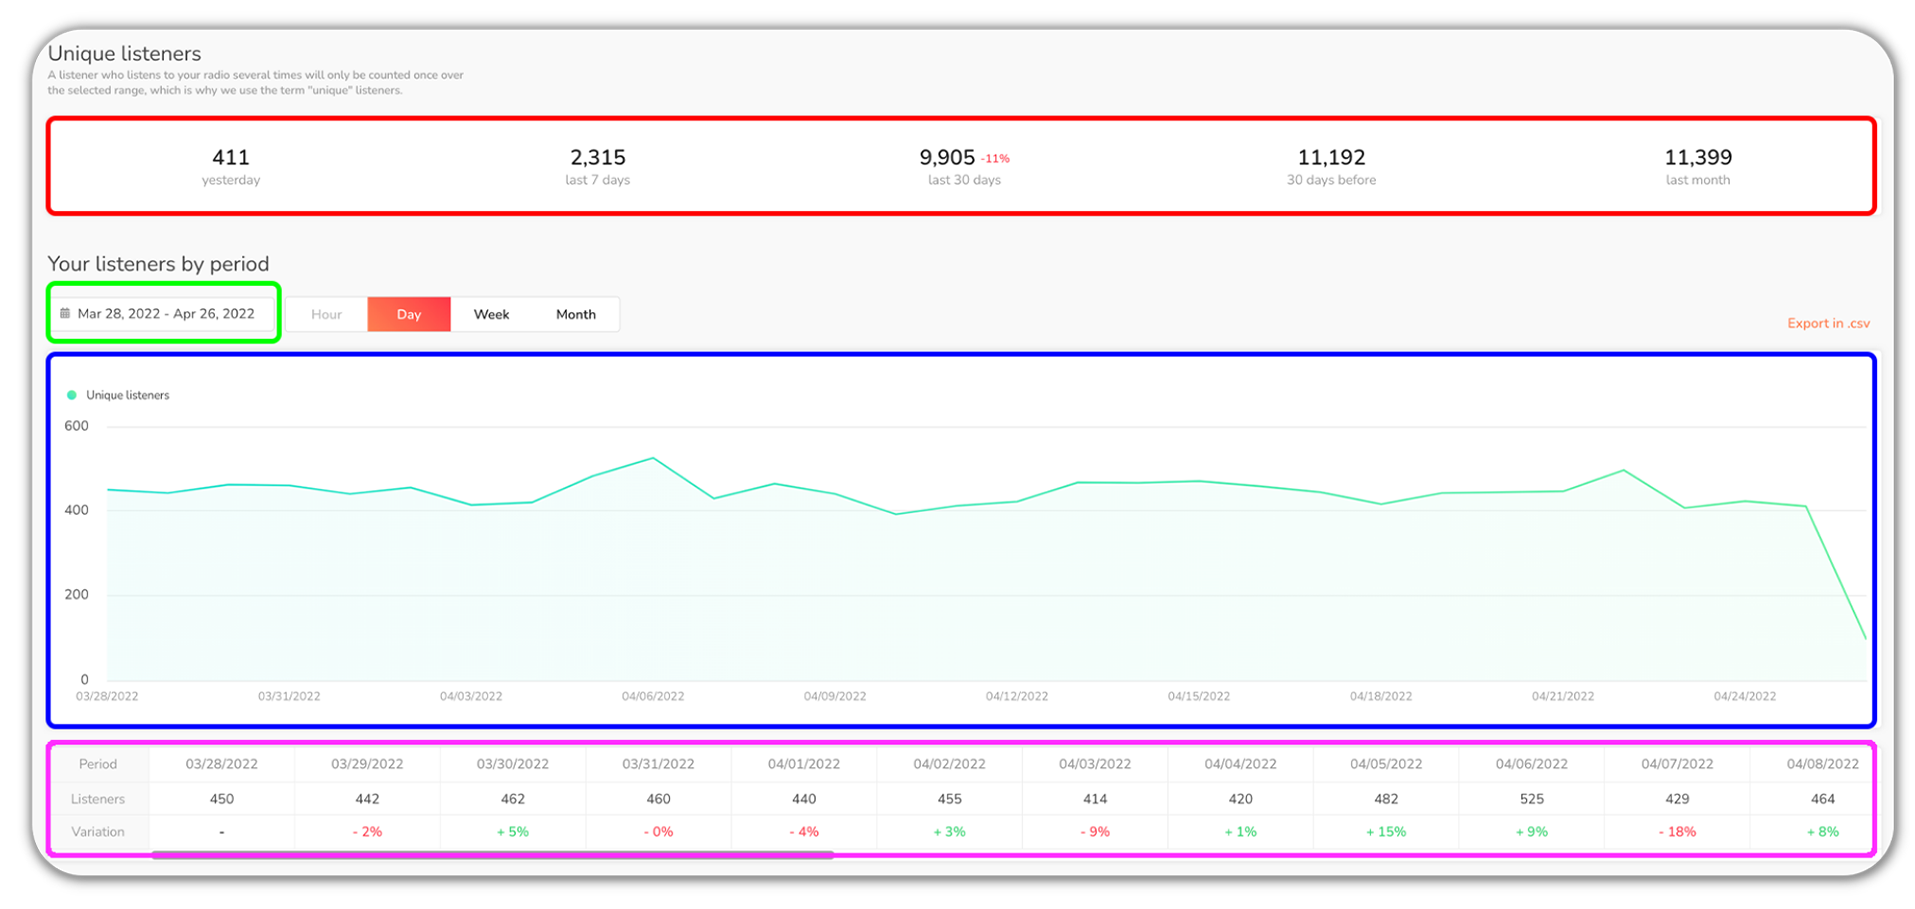
1: The table at the top gives you an overview of your unique listeners.
2: The graph gives you an idea of the evolution of the number of unique listeners over time. Feel free to hover over the graph to display the figures!
3: You can chose the period you want to observe by selecting a period via the calendar. You can choose to display the evolution by day, week, month…
4: The information is also displayed in the table below the graph.
Top Tip: Export your statistics in .csv format!
Interpreting your “Unique Listeners”
This data will allow you to check if you’re losing listeners over a number of days, weeks or months. If you notice that your numbers are going down, it may be time to refresh your programming or try offering new radio shows!
3/ Sessions
Let’s move on to the “sessions tab”. If someone connects to your radio stream 3 times in one day, it will count as 3 sessions.
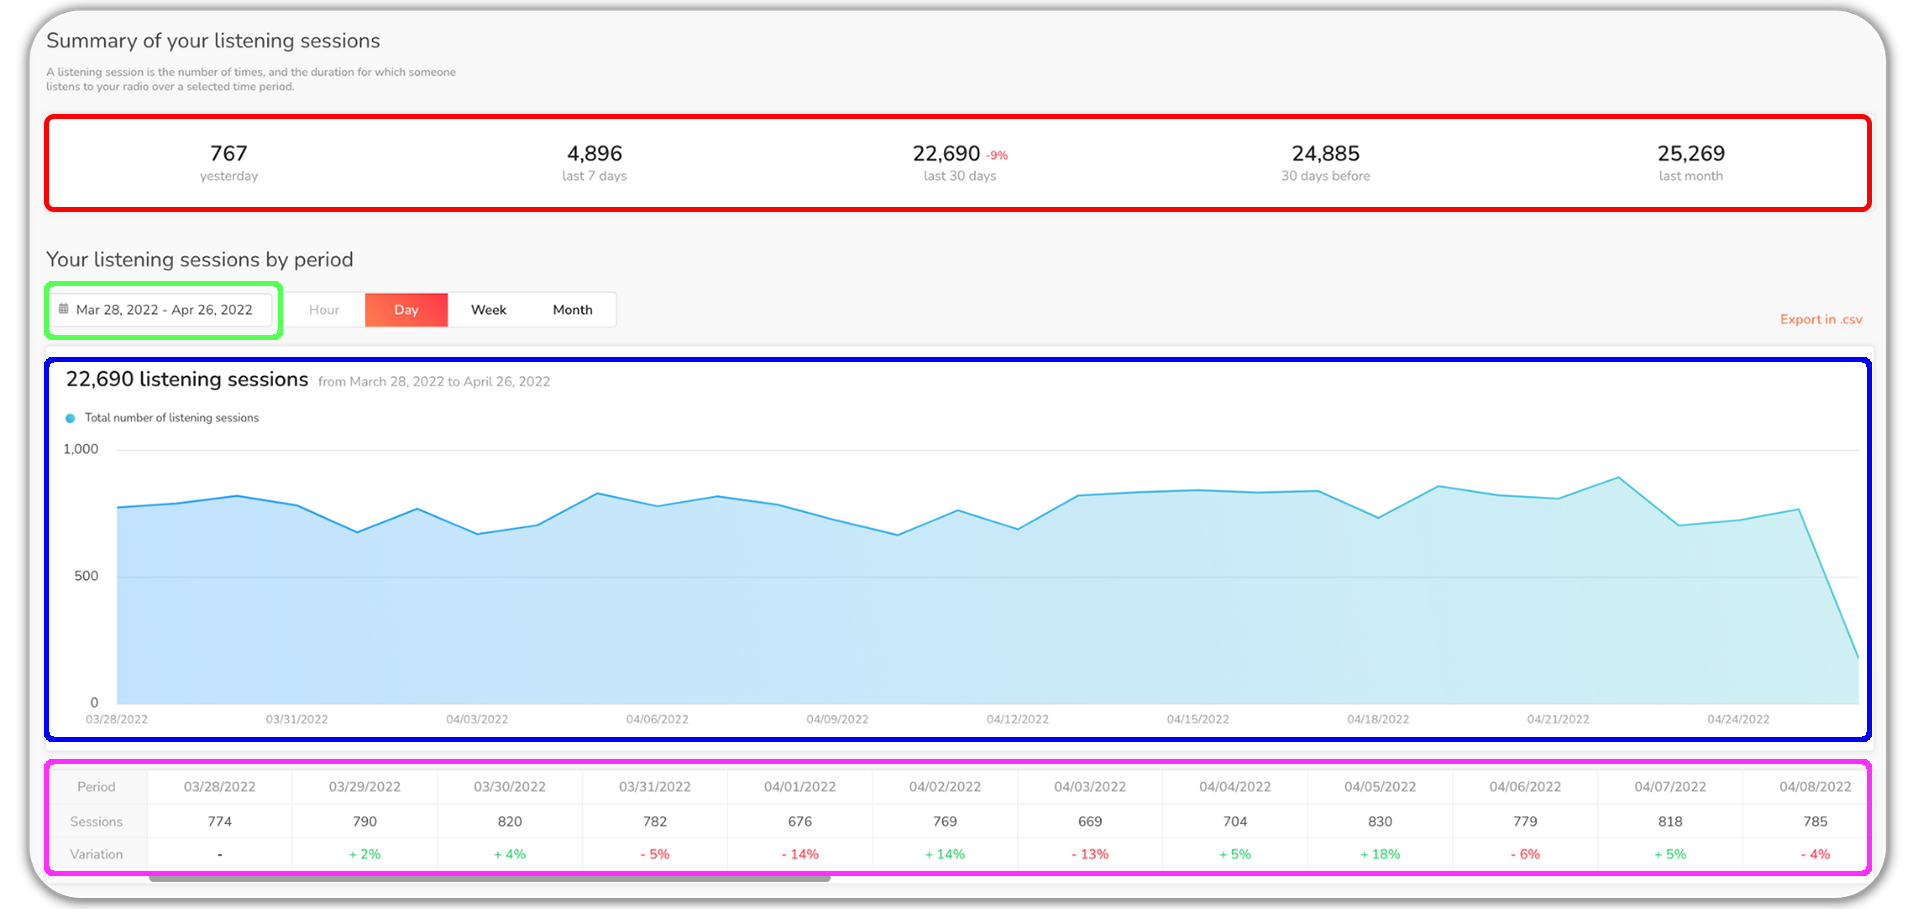
1: The table at the top gives you an overview of your sessions.
2: The graph gives you an idea of the evolution of the number of sessions over time. Feel free to hover over the graph to display the figures!
3: You can chose the period you want to observe by selecting a period via the calendar. You can choose to display the evolution by day, week, month…
4: The information is also displayed in the table below the graph.
Top Tip: Export your statistics in .csv format!
Interpreting your “Sessions” statistics
Whilst the number of unique listeners will help you understand the size of your audience, the number of sessions will tell you about the performance of your radio. It’s also interesting to compare the two statistics! For example, if the number of sessions is much higher than the number of unique listeners, it means that your audience is attached to your radio as they tune in multiple times a day.
4/ Session Duration
The “session duration” tab shows the total number of hours your radio was listened to over a certain period of time. If 100 people listened to your radio for 1 hour each yesterday, the total length of listening sessions for yesterday on your radio is 100 hours.
As for the two previous tabs, you can explore the evolution of these figures over time by choosing a specific period.
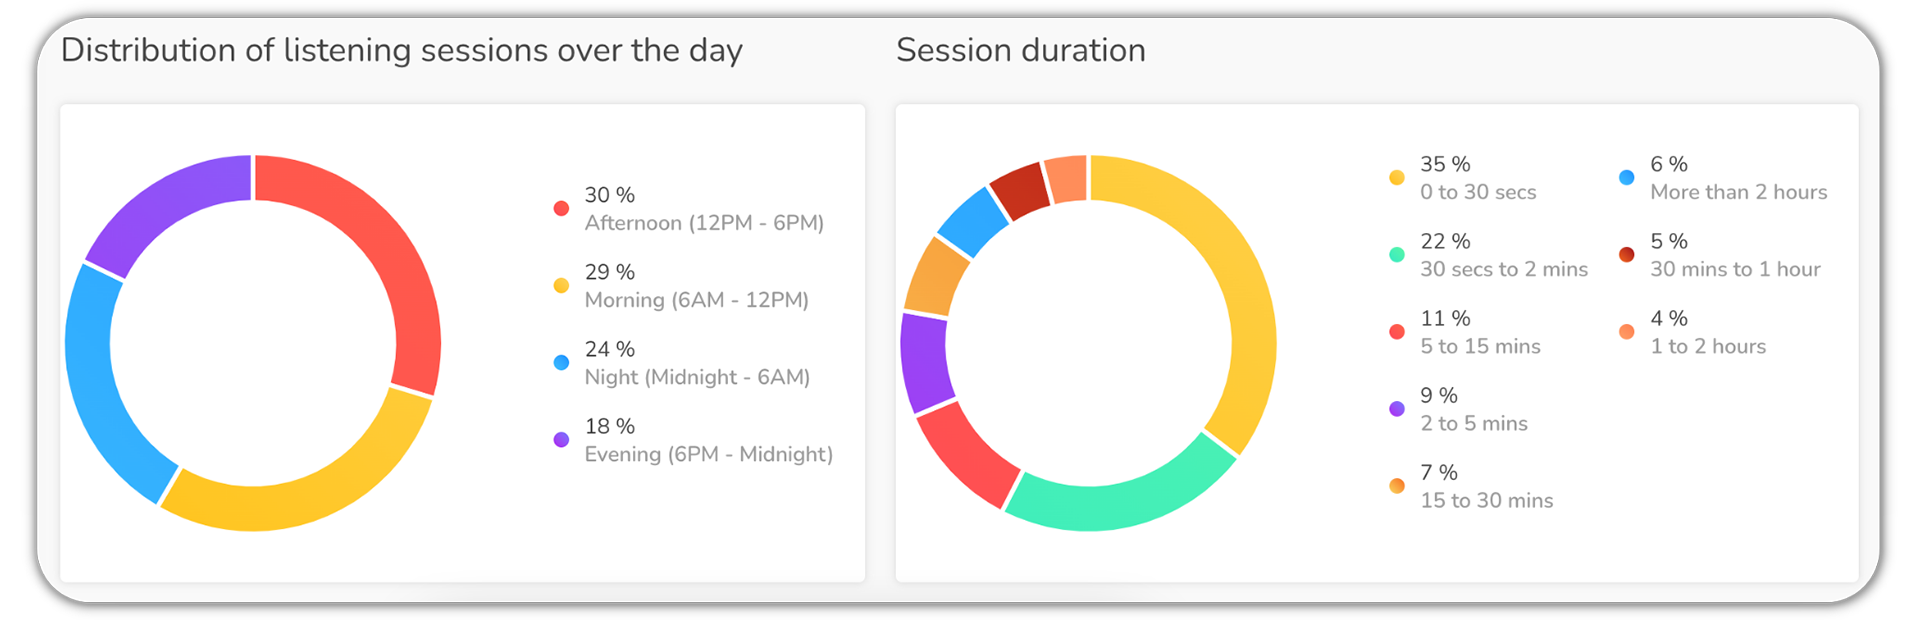
At the bottom of the page, you’ll also find 2 pie charts:
- Distribution of listening sessions over the day: shows at what time of the day your radio is being listened to.
- Session duration: shows how long people stay connected to your radio.
Top Tip: Export your statistics in .csv format!
Interpreting your “Session duration” statistics
The distribution of listening sessions will help you understand whether you have more listeners in the morning, the afternoon or evening. This will allow you to adapt your programming for when you have the most listeners (if you have a special announcement or guest for example.)
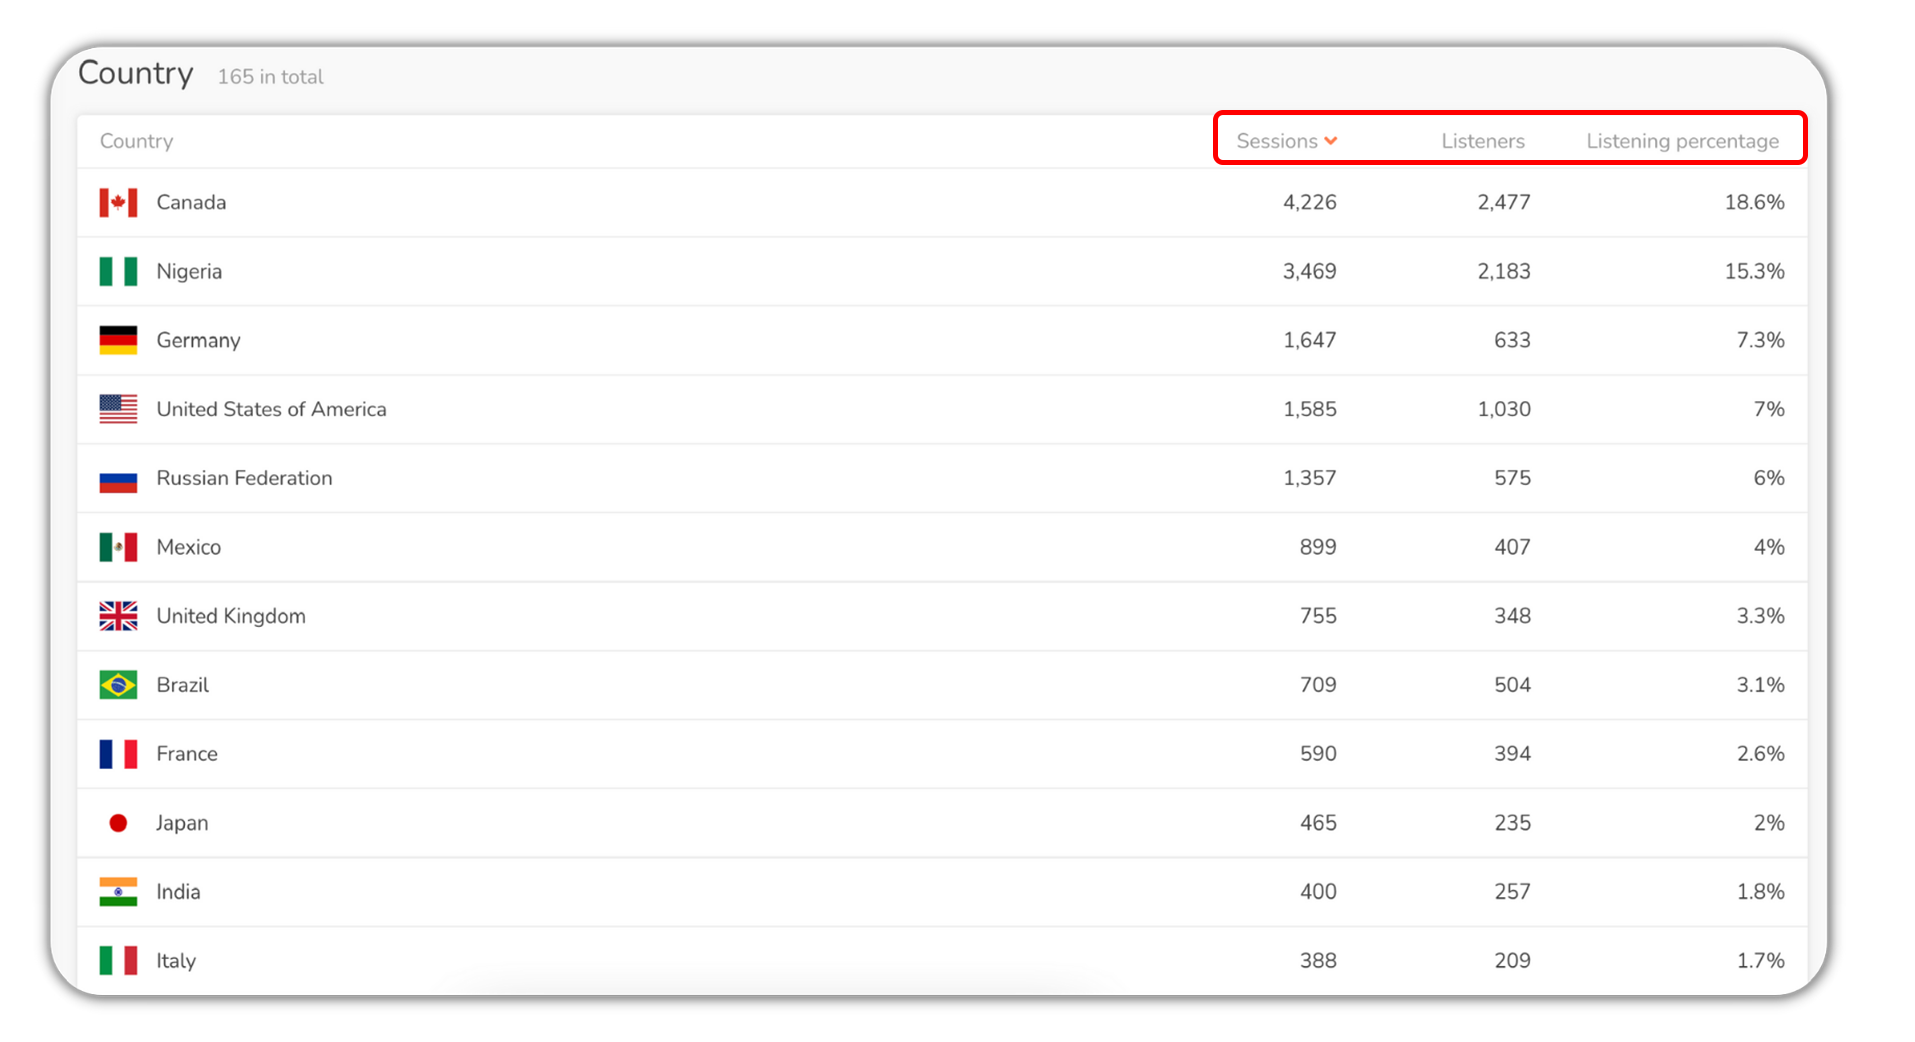
5/ Location
The “location” tab will tell you all you need to know about where your listeners are in the world! It will allow you to get information about the location of your listeners over a period of time (and not just in real-time like the first map we saw!)
The map shows the amount of listening sessions. Use the calendar to select a specific time period and hover over the map to display the listening percentage for a country.
To see the number of unique listeners per country, head over to the table below. You can sort the table by any of the available parameters, and export the results as per usual.
Top Tip: Export your statistics in .csv format!
Interpreting your “Location” statistics
Use this tab to see if your radio station has an international reach! If your goal is to develop your radio in a specific country, this tab will help you measure your objective.
6/ Music
The “music” tab will allow you to see the highest and lowest rated songs on your radio station. This ranking is based on votes made by your listeners via the RadioKing listening platform and the Radio Player widget.
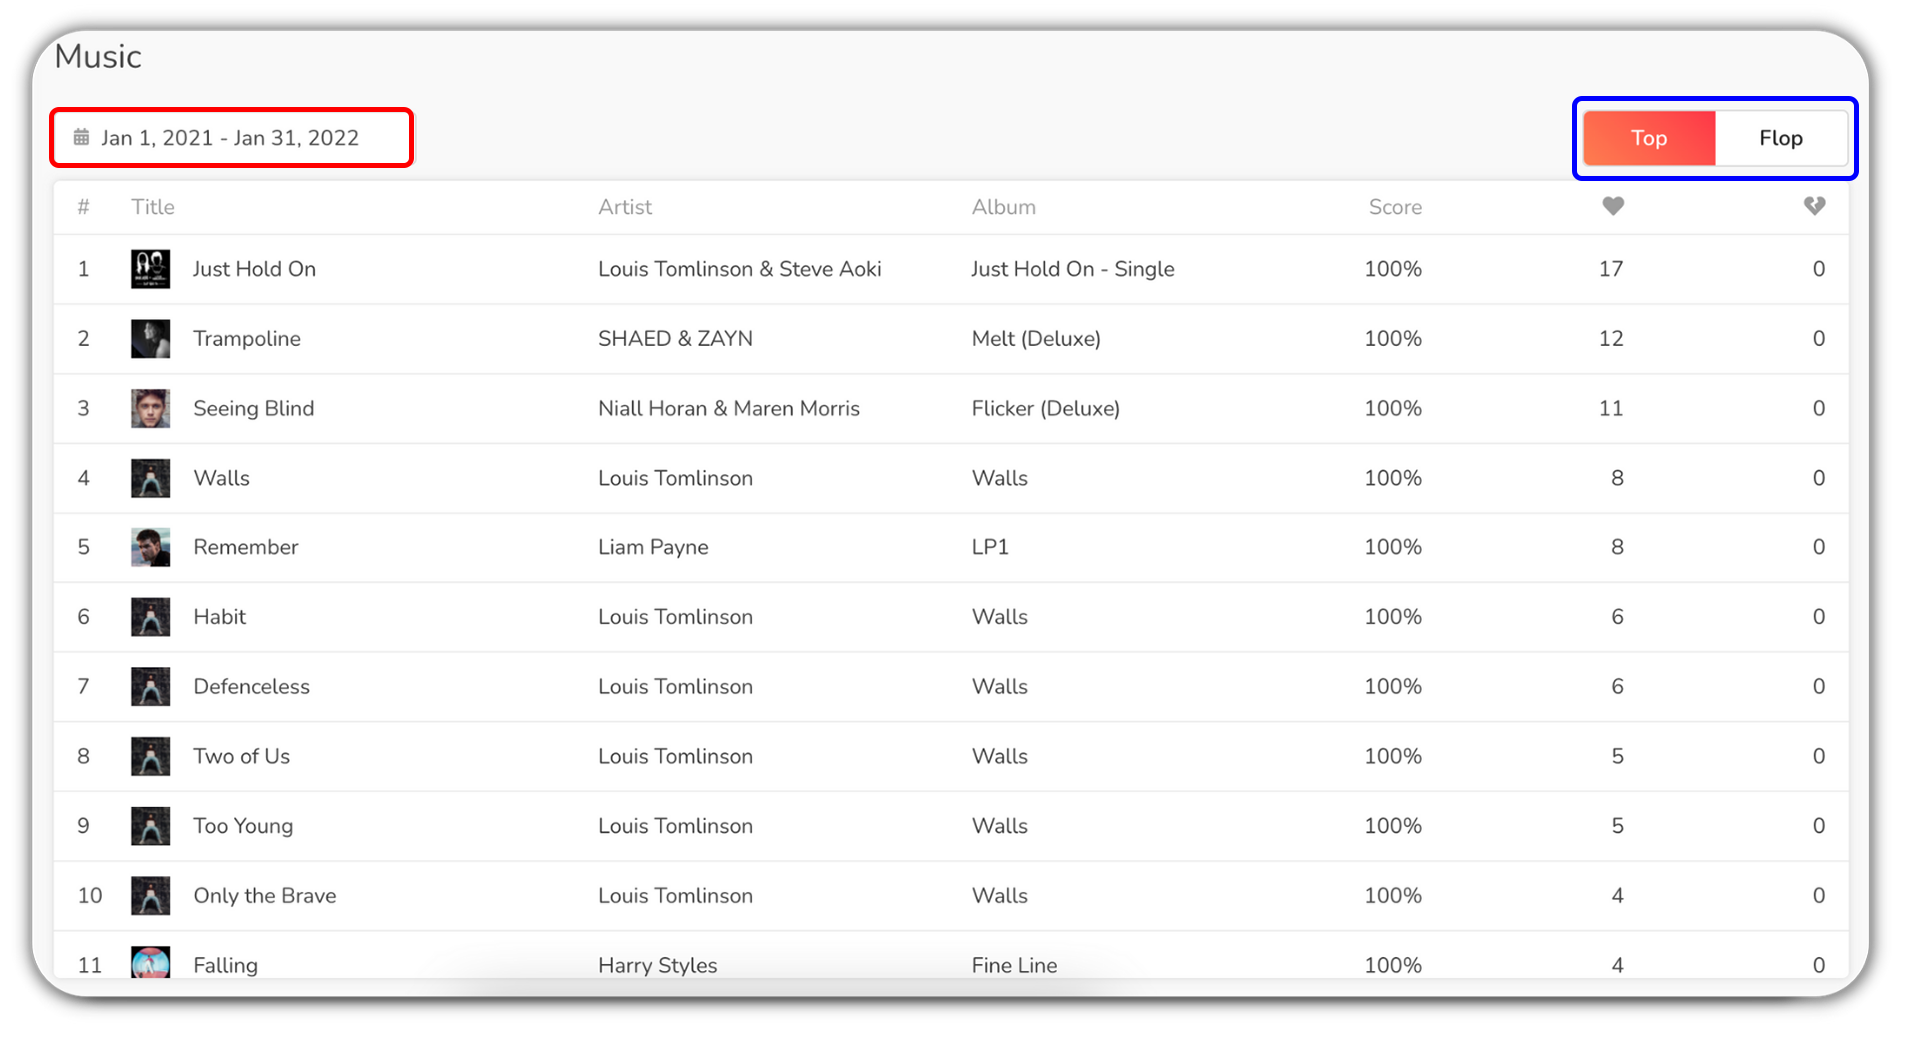
1: Select a timeframe thanks to the calendar.
2: Switch from Top to Flop (to see the highest or lowest rated songs).
Interpreting your “Music” statistics
This tab will allow you to see the songs that your listeners love, as well as those that they don’t. By looking at this information, you can adjust your musical programming to better suit the taste of your audience!
7/ Sources
The “Sources” tab gives you an overview of the type devices your listeners use to listen to your radio.
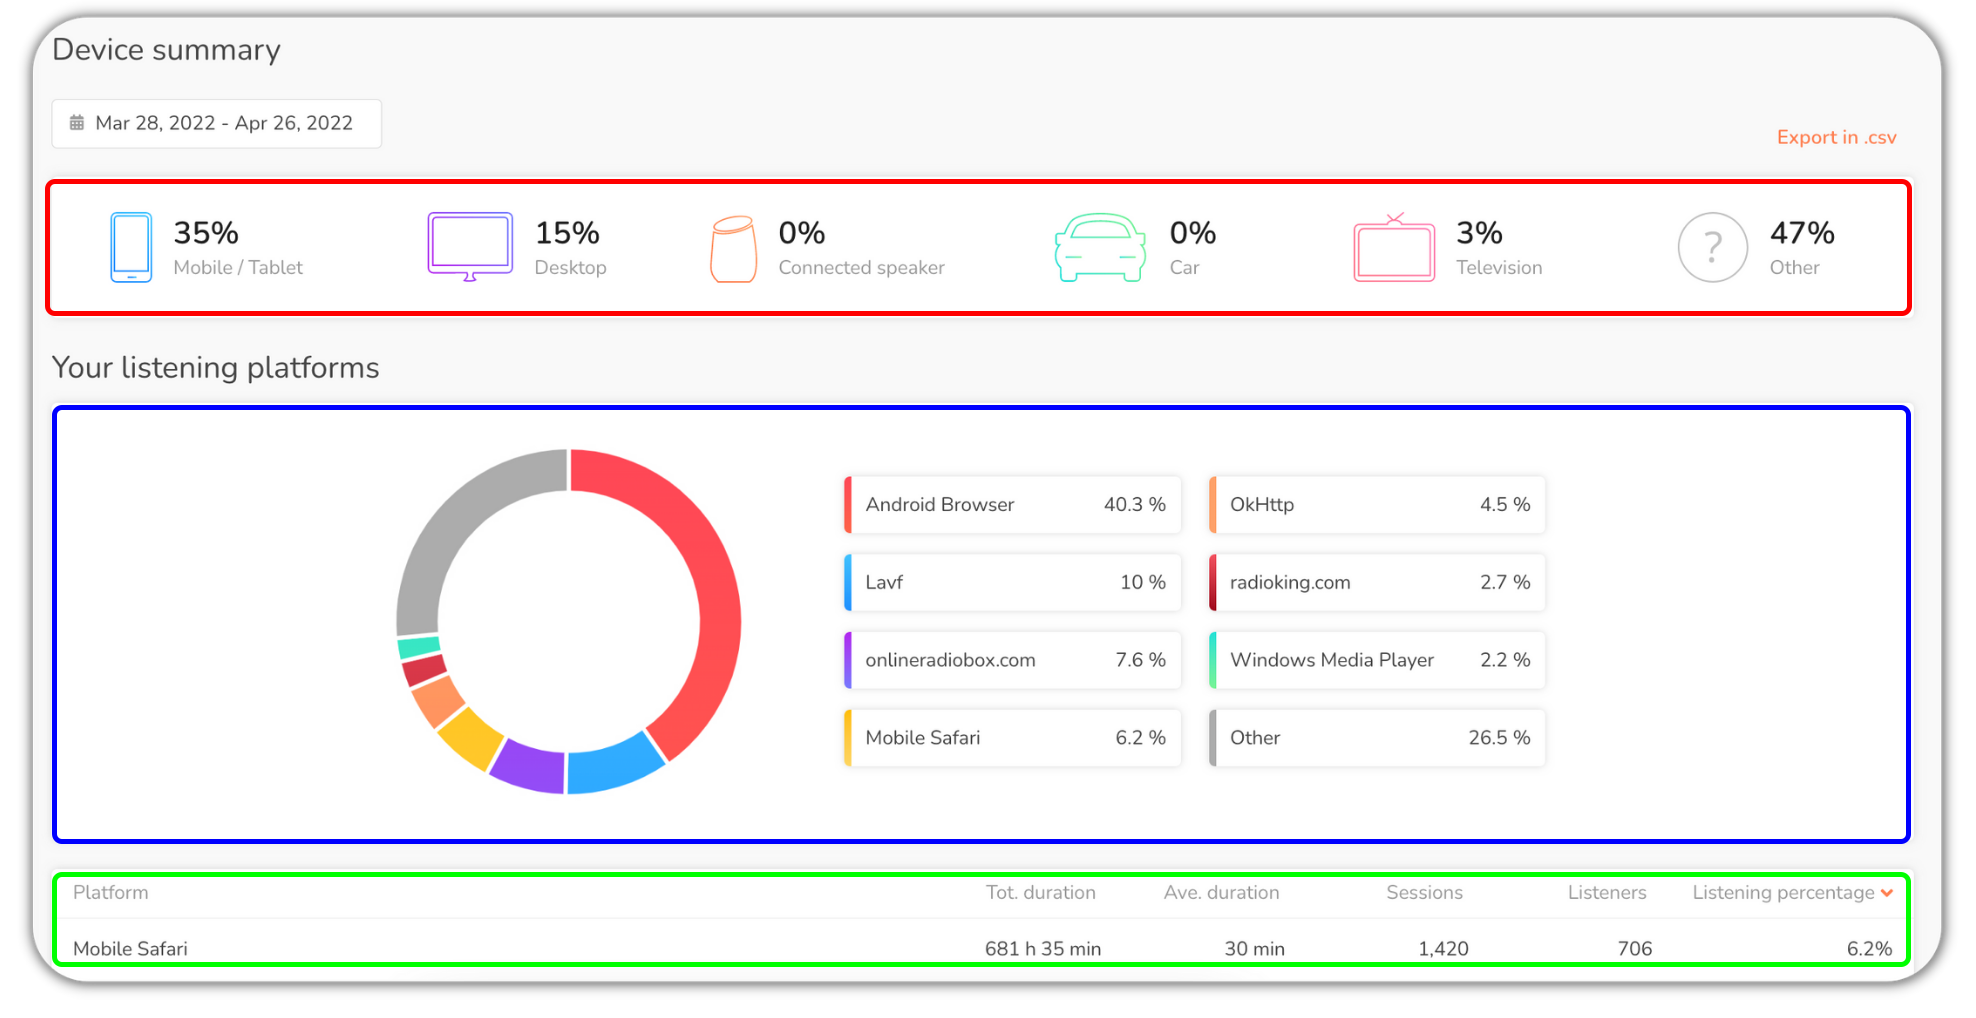
1: Summary of the distribution of your audience according to the device used to listen to your radio: Mobile/tablet, Computer, Connected speaker, Car, Television and Others.
2: The distribution of your listening sessions through the different listening platforms.
3: A complete list of all the platforms used to listen to your radio, with the total and average duration of sessions, the number of sessions, the number of listeners and the share of listening for each.
Top Tip: Export your statistics in .csv format!
Interpreting your “Sources”
This tab will help you better understand how people connect to your radio station. For example, if you see that a large amount of listening sessions are done via a web browser (Safari, Chrome, Internet Explorer…) you may want to create a radio website in order to provide easy access to your audience!
You now have everything you need in order to better understand your listeners. We really hope you enjoy this new version of the Statistics Module! If you have any feedback or suggestions for us, we would be happy to hear from you!